In a Fangraphs interview, David Laurila talked with Paul DeJong about hitting. It was a really good interview and highly entertaining read. I suggest you do so. However, I am always interested in what athletes say about their sport and how it turns out in actuality. On my own site over on Facebook, a few years ago I fact checked a former Kansas City Royal about some changes he apparently was making at the plate. It was a fun exercise. I wanted to do so again here. I'm going to look at SEVEN claims by Paul DeJong in this interview that I believe I will be able to fact check him on. However, as I said, I would totally read the entire interview!
Let's get started. First question out of the gate and Paul DeJong's answer:

Question 1a: How often does DeJong drive the ball to center field compared to league average? Question 1b: Does DeJong hit better on balls up the middle? Is that his best approach?
Answer: Paul DeJong has hit up the middle of the field 33.3% of the time in 2019 according to Fangraphs. That's the highest of his career, and thus higher than his 31.2% career average.
League average in 2019 is 34.4% up the middle. This is actually the lowest league average of the last three seasons (2017-19), so DeJong does not hit the ball up the middle as often as the average player. That doesn't mean that is not his approach however. Considering he is an above league average hitter in his career, let's see if he's more successful on those pitches.
On balls hit in the direction of the pitcher, second baseman, shortstop, and center fielder, the league has a three-year batting average of .229 with a slugging percentage of .276. That's not very good at all. As for Paul DeJong, he has a batting average of .239 with a slugging percentage of .288 on balls hit up the middle.
So maybe that's not an in-depth enough search. He specifically talks about targeting fastballs to take up the middle and hit hard. Let's see how he does. DeJong's three-year batting average on fastballs hit back up the middle is .255 with a slugging percentage of .319 compared to a league batting average of .238 and a .289 slugging. OK, so there's something. DeJong's OPS is 37 points higher than league average in those specific cases.
Last thing on this question. He tries to hit it "hard" up the middle. So what percentage of pitches does DeJong hit the ball "hard" up the middle compared to how many he simply hits up the middle? How does that compare to league average. ("Hard" will be defined with Statcast's definition of 95+ mph exit velocity - EV.)
DeJong has hit the ball "hard up the middle" on 39.8% of his balls up the middle. League average in this three-year stretch is 39.0%. He hits "hard up the middle" just slightly more often than league average. However, league average shows a .338 batting average and .453 slugging percentage on those balls compared to DeJong's .407/.570 split - 186 points of OPS higher!
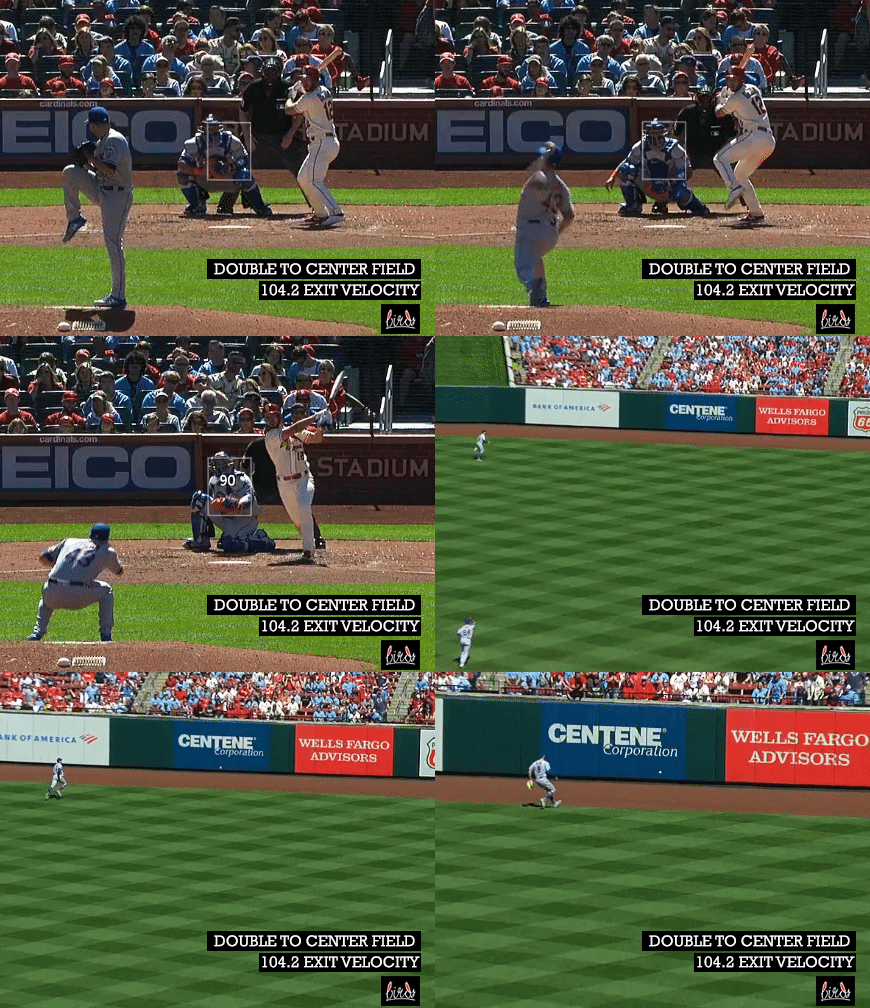
You can see below (thanks @cardinalsgifs!) that DeJong takes a good 1-2 fastball from Luis Avilan here and rips it back up the middle for a double that trails to the right-center gap.

The second question Laurila asks is where I will find the second question I will try to answer as well.

Question 2: What is DeJong's percentage of hard hit balls on breaking pitches compared to league average?
Answer: In the last three years, Paul DeJong has hit 72 breaking balls at least 95 mph off of the bat, averaging 100.8 mph on those 72 swings. Those 72 breaking balls represent 29.4% of all of his breaking balls put in play. He averages an 86.2 mph EV on those 245 swings.
League-wide data shows that players have an 85.9 mph EV on all breaking balls. They hit breaking balls "hard" on 29.8% of their breaking balls put into play, averaging 101.0 mph off the bat.
So, DeJong's are about league average in all respects here. I want to reiterate that I'm not saying that this is not his approach. However, he's not describing anything that has resulted in him doing anything different than league average and yet he's still an above league average hitter.
Laurila continues to bring the heat (ha!) on the third question, which I will try to fact check as well. DeJong's first paragraph of his answer is what I will try to fact check first...

Question 3: What is DeJong's line drive percentage on fastballs up in the zone compared to league average?
Answer: The league's three-year average is a 25.8% LD rate on fastballs up in the zone. The league averages 92.8 mph off the bat on those line drives.
Paul DeJong's three-year average is a 20% LD rate on fastballs up in the zone. He averages 87.9 mph off the bat on those line drives. DeJong's approach is not really working for him here.
DeJong continues on in his response to Laurila's question about fastballs riding high in the zone with an extended quote about being a low ball hitter, however. Here are DeJong's words:

Question 4a: Is Paul DeJong a low ball hitter compared to league average? Question 4b: Does Paul DeJong hit low balls better than he hits balls up in the zone? (Personally, I believe everyone is more of a "middle" hitter than a high ball hitter or low ball hitter. So I'll compare high v. low here.)
Answer: For these purposes, I supposed that DeJong was talking about pitches IN the zone only in terms of being a "low ball hitter." DeJong has a .384 wOBA on pitches low in the zone compared to league average of a .302 wOBA over the last three years. So it seems DeJong's recognizing something obviously true in this case. Does DeJong hit low pitches better than he hits high pitches, however? The answer to that is another resounding yes as he has a .298 wOBA up in the zone.
Here is DeJong taking a 2-0 fastball that's 95 mph and low on the black from none other than Max "Cy Young" Scherzer and ripping it up the middle for an easy single.

Laurila asks a question about DeJong's ability to recognize spin and DeJong spins that in a way that makes himself sound good.

I think this one is a pretty easy one to fact check. The question:
Question 5: Is DeJong's O-Zone swing percentage going down year to year?
Answer: DeJong again is showing that he knows his swing here. In 2017, DeJong swung at 33.6% of pitches outside of the zone. In 2018, DeJong dropped that to just 29.8% of pitches outside of the zone at which he offered. This year, he's all the way down to 27.6% - well below league average of 31.1% this year.
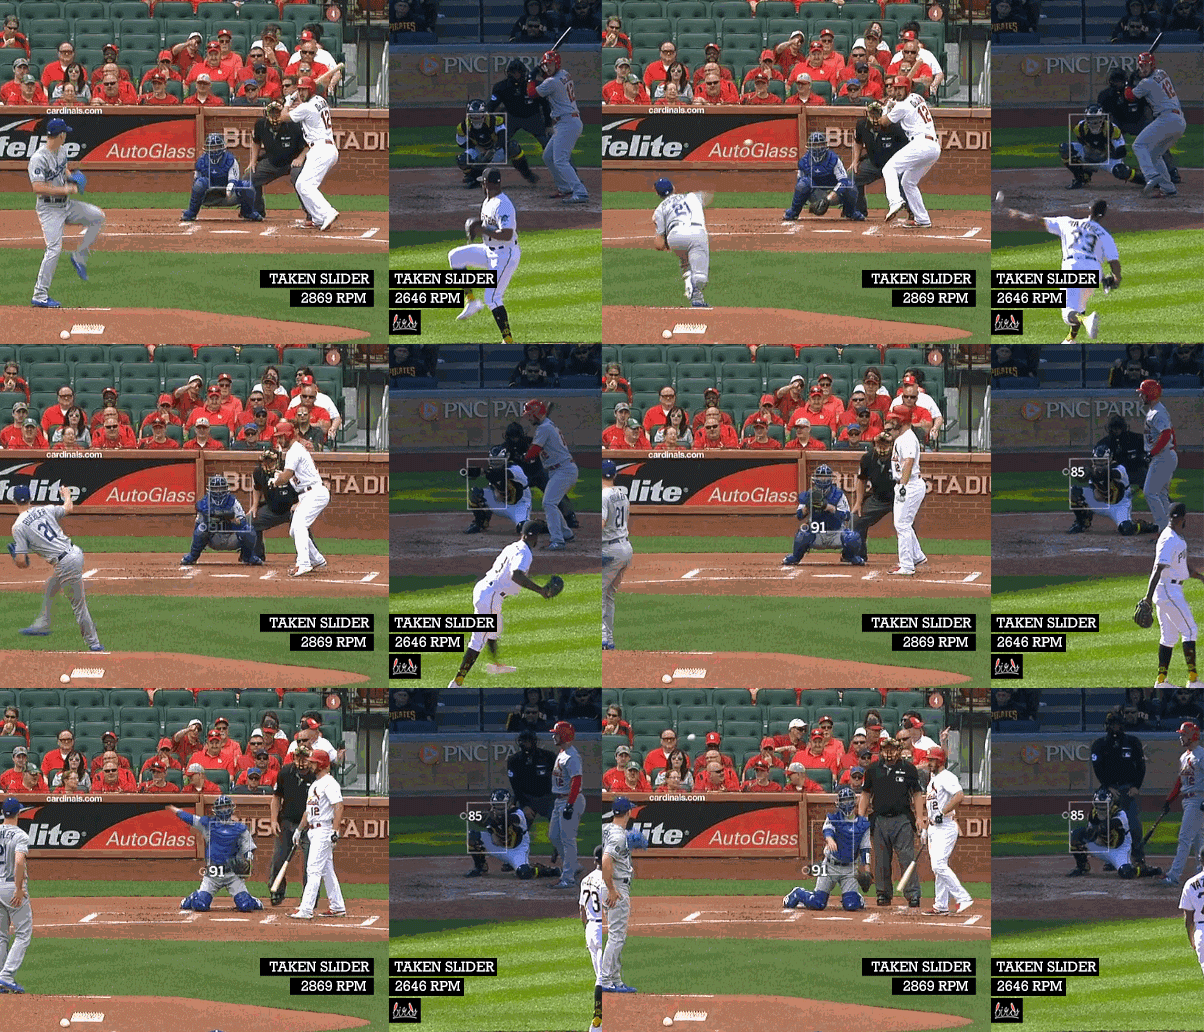
Watch DeJong recognize the high spin sliders here from Felipe Vazquez (one of the best closers in baseball the last couple of years) and Walker Buehler (one of the best young pitchers in baseball) and take both for close balls.

Laurila and DeJong continue to talk hitting breaking balls and that leads me to my 6th and 7th questions, the 6th coming from these two exchanges:

Question 6: How well does Paul DeJong hit breaking balls up compared to league average?
Answer: For this answer, I looked at all breaking balls up in the zone and in the middle of the zone horizontally. That's typically higher than you want a breaking ball to land - although that is all changing the last couple of years. DeJong hits breaking balls up to the tune of a .451 wOBA in his career. That's elite! League average is .332. DeJong destroys high breaking balls.
Paul DeJong is able to recognize a hung curve ball from Chris Flexen here. By the time the left fielder got there, I'm not sure he recognized tha piece of hide, string, and rubber as a ball any more, though

And lastly, the next question after the above exchange had to do with sliders that kind of back up or have less movement than normal.

I liked the thought in the last sentence there about "sometimes a breaking ball...stays in that up-and-in corner...get[ting] a lot of hitters out."
Question 7: How often do sliders up and in get hitters out - in comparison to other sliders?
Answer: The league hit .214 on up and in sliders from same-handed pitchers over the last 3 years. DeJong is 0-1 on up and in sliders that end a PA. It was not against Daniel Mengden, but Sal Romano of the Reds back in 2018.

If you expand the zone slightly (catcher's perspective), to zones 1, 24, and 11 for RHB v. RHP and zones 3, 6, and 12 for LHB v. LHP. as seen below on the strike zone shown, does it change at all? Let's see.
On those pitches over the last 3 years, DeJong has hit .214 (3-14). League average on those pitches was .257. So yes, DeJong has found those statistically more difficult pitches to handle.
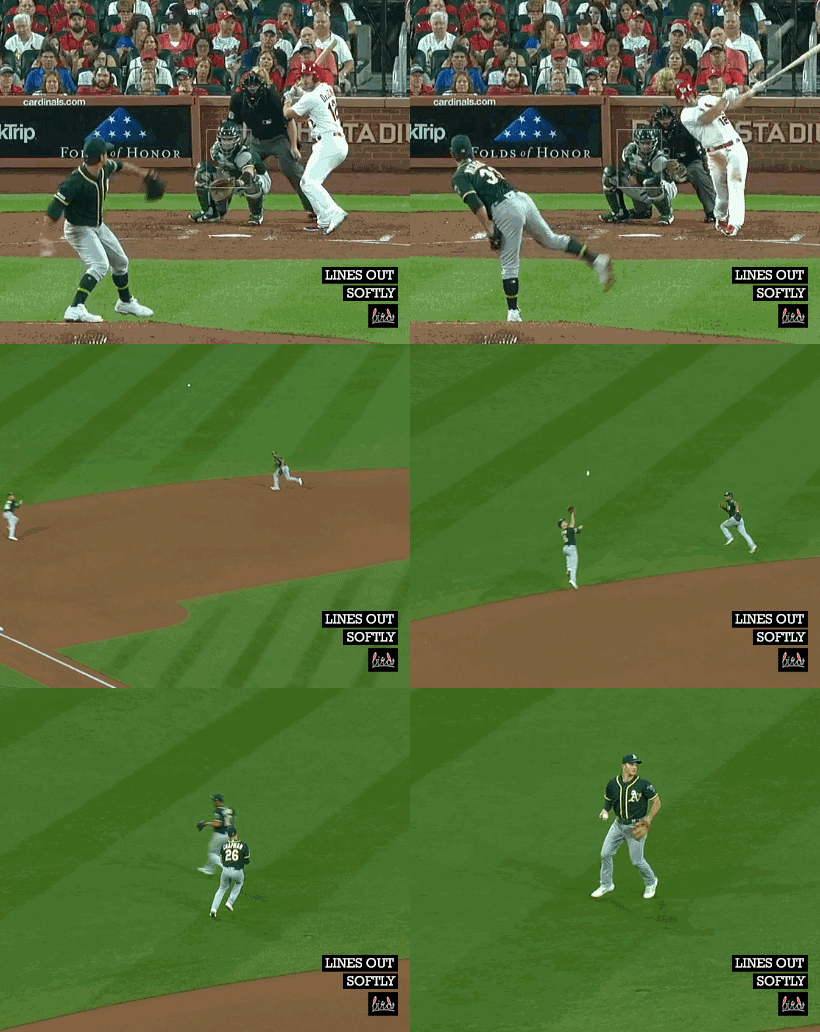
To be fair, one of those pitches that he lined out softly to third on was from this past week - against Daniel Mengden.
I usually attempt to end with a .gif that is quite positive even if I'm taking a look at a player who is struggling. This time, however, I'll end with that line out off of Mengden, as it was a good illustration of what DeJong was talking about when speaking on the action of a back-up slider.


